How to Find Outliers (and how to handle these) In Excel
Managing outliers in your data collection is a common problem when dealing with data in Excel.
All types of data frequently contain outliers, thus it’s critical to recognize and deal with these outliers to ensure that your research is accurate and useful.
In this article, I’ll demonstrate how to locate outliers in Excel as well as a few handling strategies I’ve employed in the past.
This instruction explains:
1. What Are Outliers, and Why Should We Look for Them?
2. Identify Outliers in the Data by Sorting
3. Utilizing the Quartile Functions to Find Outliers
4. Utilizing the LARGE/SMALL tools to Find the Outliers
5. How to Approach Outliers Correctly
1. What Are Outliers, and Why Should We Look for Them?
A data point that far exceeds the other data points in the data set is an outlier. When you have an outlier in your data, it might distort your results and cause false conclusions to be drawn.
I’ll use a straightforward example.
Let’s imagine that 30 individuals are on a bus from point A to point B. Everyone belongs to the same income and weight groups. For the sake of this tutorial, let’s assume that the average weight is 220 pounds and the average annual income is $70,000.
Bill Gates gets on the bus as it pauses in the middle of our trip at this point.
Now, what do you think this would do to the average weight and the average income of the individuals on the bus?
While the average weight of those riding the bus is unlikely to alter significantly, their average income will.
This is because Bill Gates’ salary is an outlier in our sample, which causes us to interpret the data incorrectly. A few billion dollars would be the average annual revenue for each passenger on the bus, much above the vehicle’s real value.
Excel allows you to work with real datasets, but you may encounter outliers in any direction (i.e., a positive outlier or a negative outlier).
You must locate these outliers in some way, decide how to handle them, and make sure your study is accurate after that.
Let’s now look at a few techniques for finding outliers in Excel.
2. Identify Outliers in the Data by Sorting
Sorting the data and manually going through some of the numbers at the top of this sorted data can quickly find outliers in small datasets.
Make careful to sort the data in ascending order first, then in descending order, and then go through the top values because there may be outliers in both directions.
I’ll give you an illustration.
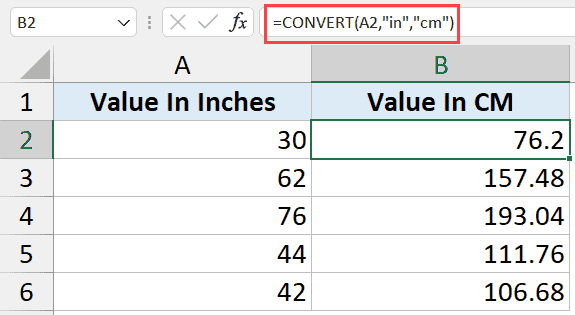
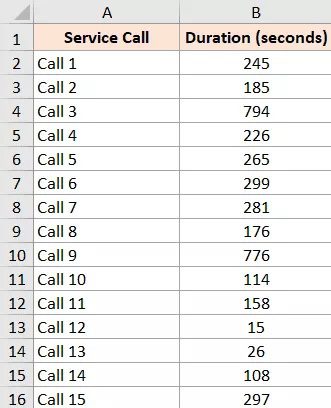
I’ve included a dataset with call times (measured in seconds) for 15 customer support calls below.

- The steps to sort this data are shown below so that we may see any outliers in the dataset:
- The column whose header you wish to sort should be selected (cell B1 in this example)
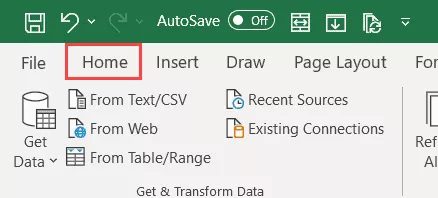
- On the Home tab, click
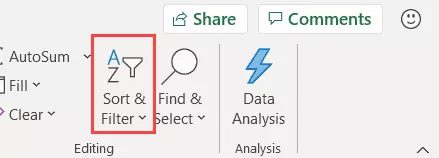
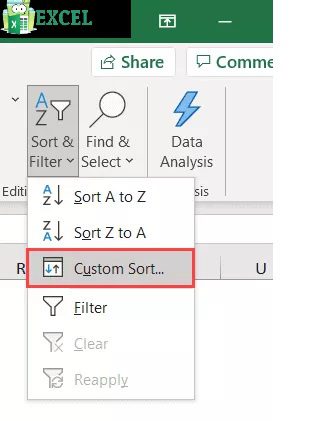
- Select the Sort & Filter icon in the Editing group.
- Select Custom Sort.
- Choose “Duration” from the Sort by drop-down and “Largest to Smallest” from the Order drop-down in the Sort dialogue box.
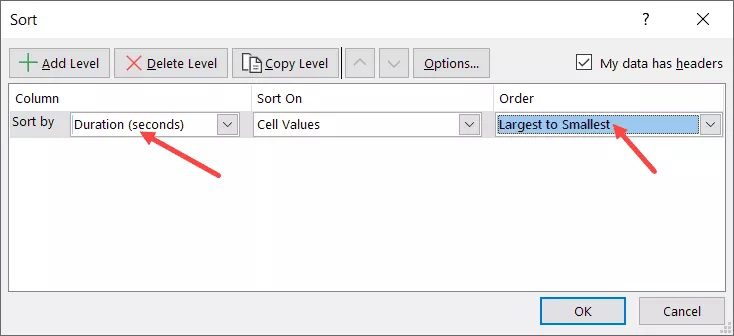
- Press “OK”
The call duration column would be sorted using the aforementioned steps, with the higher values at the top. The data may now be manually scanned to check for outliers.
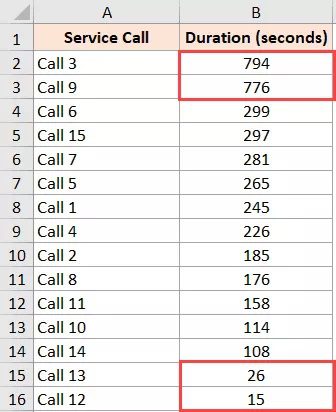
I can see from our example that the first two values are significantly higher than the remaining values.
It should be noted
that this method only works with small datasets that can be manually scanned.
Despite not being scientific, it is effective.
3. Utilizing the Quartile Functions to Find Outliers
Let’s now discuss a more scientific method for determining whether or not there are any outliers.
A quartile in statistics refers to the fourth of the data collection. If there are 12 data points, for instance, the first quartile would consist of the bottom three, the second quartile of the next three, and so on.
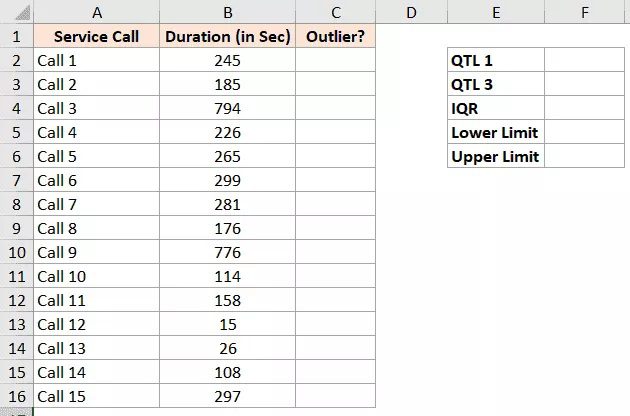
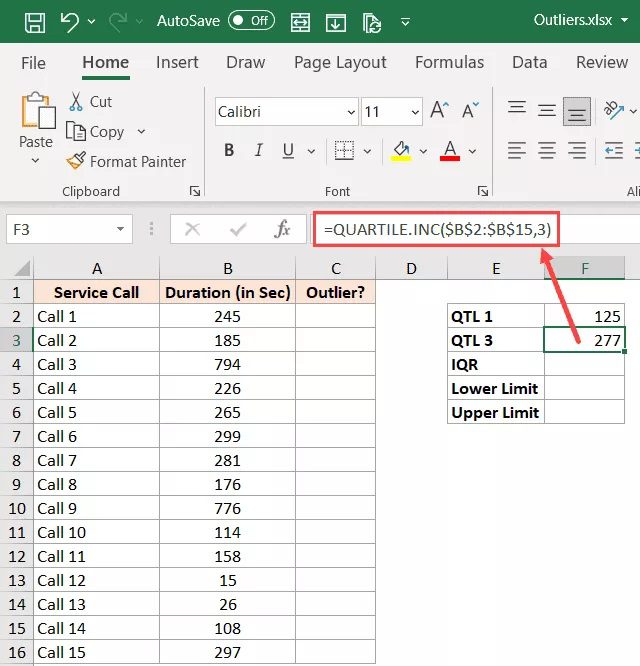
The data set where I’m looking for outliers is shown below. To do this, I must first determine the first and third quartiles, utilizing those results to determine the upper and lower bounds.
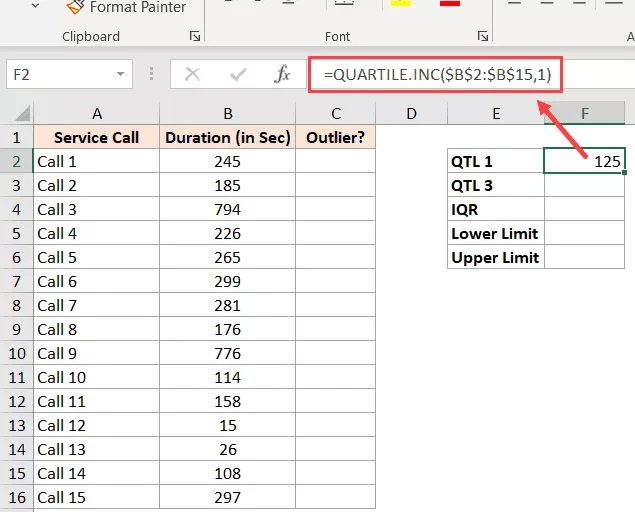
The first quartile in cell E2 may be determined using the formula shown below:
=QUARTILE.INC($B$2:$B$15,1)
=QUARTILE.INC($B$2:$B$15,3)
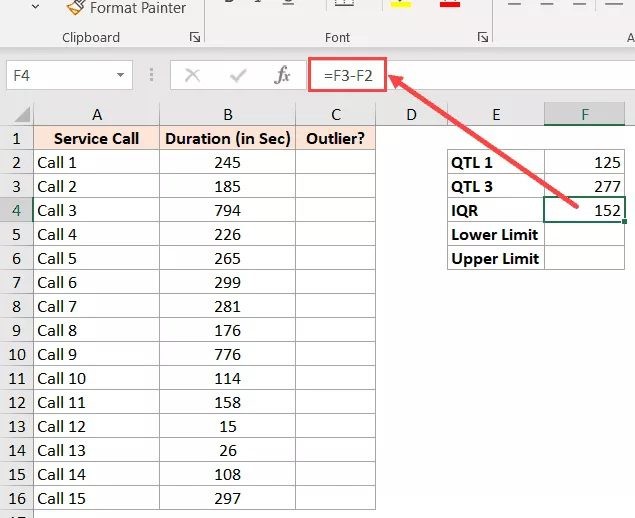
The Interquartile Range (which is 50% of our data within the first and third quartiles) may now be obtained using the two formulas mentioned above.
=F3-F2
To determine the lowest and higher limits that would encompass the majority of our data, we will now utilize the interquartile range.
Then, anything that deviates from these lower and higher bounds would be regarded as an outlier.
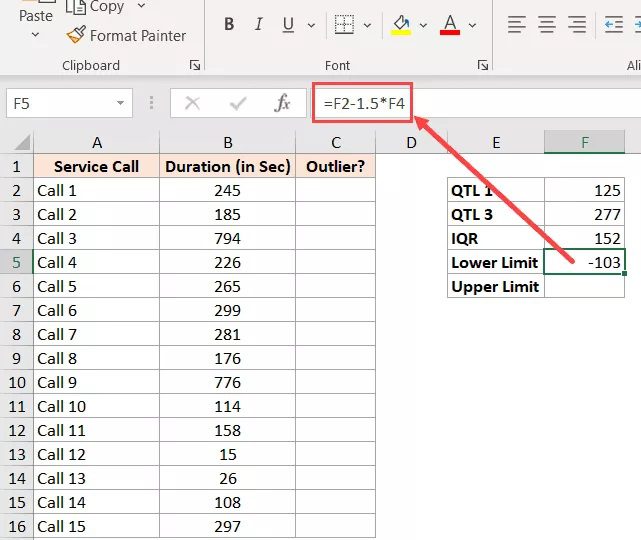
The formula for determining the lower limit is given below:
=Quartile1 - 1.5*(Inter Quartile Range)
This, in our illustration, becomes
=F2-1.5*F4
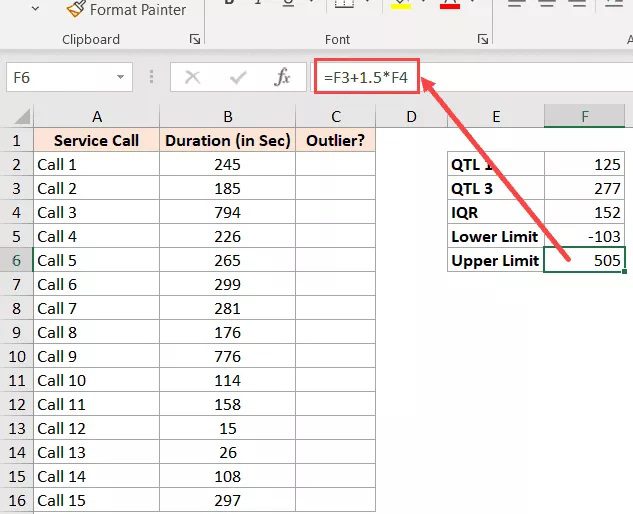
The following formula is used to determine the upper limit:
=Quartile3 + 1.5*(Inter Quartile Range)
This, in our illustration, becomes
=F3+1.5*F4
With the upper and lower limits in our data set now, we can immediately spot numbers that do not fall inside this range by going back to the initial data.
Checking every item and returning a TRUE or FALSE in a new column would be a simple method to accomplish this.
To get TRUE for those numbers that are outliers, I utilized the OR algorithm below.
=OR(B2<$F$5,B2>$F$6)
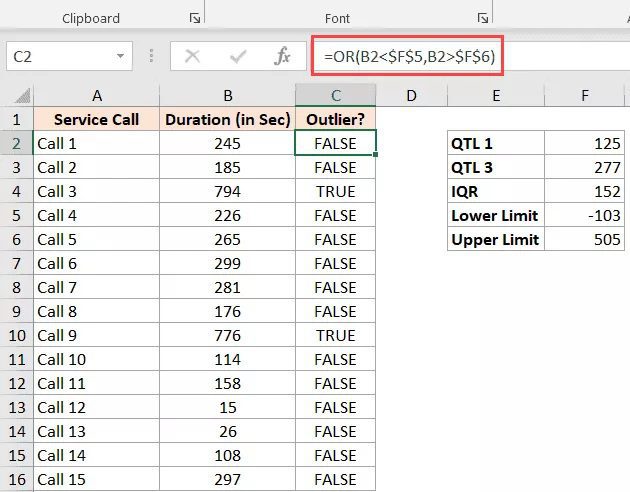
You can now filter the Outlier column to only display the records with a TRUE value.
As an alternative, conditional formatting can be used to highlight all of the cells with a TRUE value.
Note:

Although this is a more often used technique to identify outliers in statistics.
This approach seems a little bit unworkable in practical situations.
Since the dataset we have can only be positive,
the formula's bottom limit in the example above is -103.
Therefore, while this method can aid in locating outliers in one direction (high values),
it is useless for doing so in the opposite direction.
4. Utilizing the LARGE/SMALL tools to Find the Outliers
You may extract the highest and lowest 5 or 7 values from a huge set of data (values in numerous columns) to check for any outliers.
Without having to look through all of the data in both directions, you will be able to see any outliers.
Let’s say we have the dataset below and wish to find any outliers.
The algorithm that will provide you with the dataset’s highest value is listed below:
=LARGE($B$2:$B$16,1)
The second-largest value will similarly be provided by
=LARGE($B$2:$B$16,1)
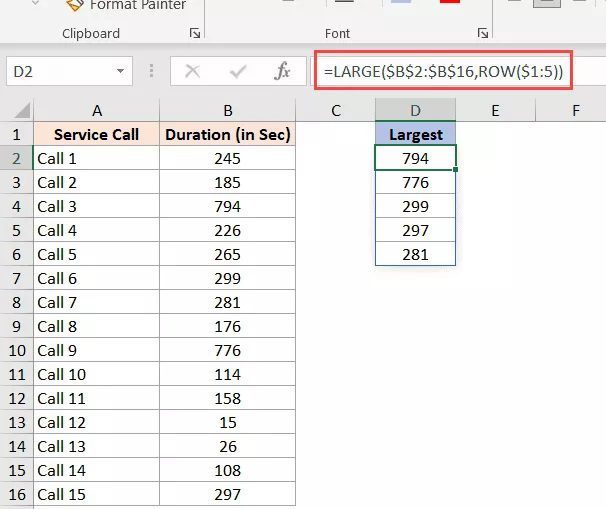
The following formula will give you the five largest values from the dataset if you are not using Microsoft 365, which supports dynamic arrays:
=LARGE($B$2:$B$16,ROW($1:5))
Similarly, apply the following formula to get the lowest five values:
=SMALL($B$2:$B$16,ROW($1:5))
In a similar vein, apply the following formula to get the least 5 values:
=SMALL($B$2:$B$16,1)
When you know these numbers, it’s quite simple to identify any outliers in the sample.
Depending on the size of your dataset, you may opt to receive 7 or 10 values instead of the greatest and lowest 5, as I have done.
I’m not sure whether this is a good way to detect outliers in Excel, but I did it that way a few years ago when I had to deal with a lot of financial data for work. This approach seems to work the best out of all the ones discussed in the course.
5. How to Approach Outliers Correctly
We have already seen some of the techniques that will be used to locate outliers in our data collection. But what should you do after discovering that there are outliers?
Here are a few approaches you can take to deal with outliers and ensure that your data analysis is accurate.
Get rid of the outliers
Simply deleting outliers from your data collection is the simplest approach to do it. In this method, your analysis won’t be tainted.
When you have a huge dataset and the removal of a few outliers won’t affect the analysis as a whole, it’s a more practical option. Of course, you should make a copy of the data first and investigate the reasons for the outliers before destroying the original.
Normalize the Extreme Values (Adjust the Value)
When I had a full-time job, I used to try to normalize the outliers. I would just change all the outlier values to a value that is marginally higher than the highest value in the data set.
This ensured that I wasn’t erasing the data while also making sure that my data wasn’t being skewed.
To give you an example from real life, if you were evaluating the net profit margin of businesses, and most of them fell between -10% and 30%, but a few percentages were above 100%, I would simply alter these outlier values to 30% or 35%.
These are a few of the techniques you may employ in Excel to identify outliers.
Once the outliers have been located, you may investigate the data to see what’s generating them while also selecting a method to deal with these outliers (which could be removing these or normalizing these by adjusting the value)
I sincerely hope this instruction was helpful.